12 Experiential Marketing Metrics to Measure ROI

When done right, experiential marketing doesn’t just capture attention—it earns it. But creativity alone isn't enough. To justify spend and refine future strategies, business owners and marketers must prove the impact of experiential campaigns with clear, actionable data.
Here are 12 essential metrics to track when measuring ROI from consumer activations, product launches, and immersive experiences.
1. Foot Traffic / On-site Engagement
This is your starting point for understanding scale. Measuring how many people visited your activation—along with how they moved through the space—helps you gauge reach and attraction. Look at dwell zones, peak times, and total impressions to understand how compelling your physical presence really was.
2. Registrations / Check-ins / Actual Attendance
Intent and follow-through matter. This metric tells you how many people committed to showing up versus how many actually did. It also reflects how compelling your invitation and brand story are—especially in exclusive, curated settings like Kohl’s: An Evening with Ellie, where high-profile attendance reinforced the brand’s cultural relevance.
3. Dwell Time or Session Duration
Time spent engaging with your brand is a strong indicator of interest and emotional connection. Whether at a physical booth, immersive experience, or branded event, longer dwell time often correlates with deeper engagement. Activations like Google Android: The Heart of Gaming demonstrate how multi-sensory environments can captivate audiences and keep them immersed for extended periods.
4. Website Traffic & Digital Engagement
Track web visits, landing page sessions, bounce rate, and session duration post-activation. These insights can show how your physical experience impacted online behaviour, and where digital storytelling could further enhance the journey.
5. Conversion Rate (Leads → Sales)
From lead capture forms to direct purchases, the conversion rate is your bottom-line indicator. How many meaningful contacts became customers? Map this across your sales funnel to highlight drop-off points and optimise touchpoints.
6. Social Media Reach, Mentions & User-Generated Content (UGC)
Monitor branded hashtags, geotags, mentions, and shares to measure how far your activation travelled online. UGC, in particular, is a goldmine—attendees creating and sharing their own content is a clear sign your experience resonated.
7. Sentiment & Brand Perception Shift
It’s not just what people say, but how they feel. Use social listening tools and post-event surveys to gauge changes in brand perception. Did the experience move the needle on favourability, trust, or relevance? Creative work like Monument Valley III shows how immersive storytelling and aesthetic design can leave a lasting emotional impact on audiences.
8. Return on Investment (ROI) / Cost per Outcome
This metric ties campaign spend to outcomes like leads generated, sales, social reach, or brand lift. Calculate ROI with both hard numbers (revenue) and soft gains (brand equity) to get a fuller picture of campaign success. Activations like Avalara at Money 20/20 demonstrate how strategic design, targeted audience engagement, and real-time analytics can deliver measurable impact and clear value.
9. Retention / Repeat Engagement
Experiential marketing can spark long-term relationships. Track re-engagement through email sign-ups, content downloads, event return rates or participation in loyalty programs to see how well your experience fostered brand loyalty.
10. Advocacy / Brand Mentions After the Event
Look beyond the day-of buzz. Are people still talking about the experience a week or a month later? Persistent positive mentions, blog posts, and social shares are a sign that your campaign had staying power. The Motorway Drive-In Experience is a perfect example of an activation that resonated far beyond the event itself, sparking organic advocacy through emotional storytelling.
11. Traffic Sources & Channel Attribution
Knowing where your audience came from—social, paid ads, influencer campaigns, email—helps allocate future spend wisely. Use UTM codes and tracking pixels to attribute conversions to the correct channels.
12. Engagement Quality Metrics (Heatmaps, Clicks, Interactions)
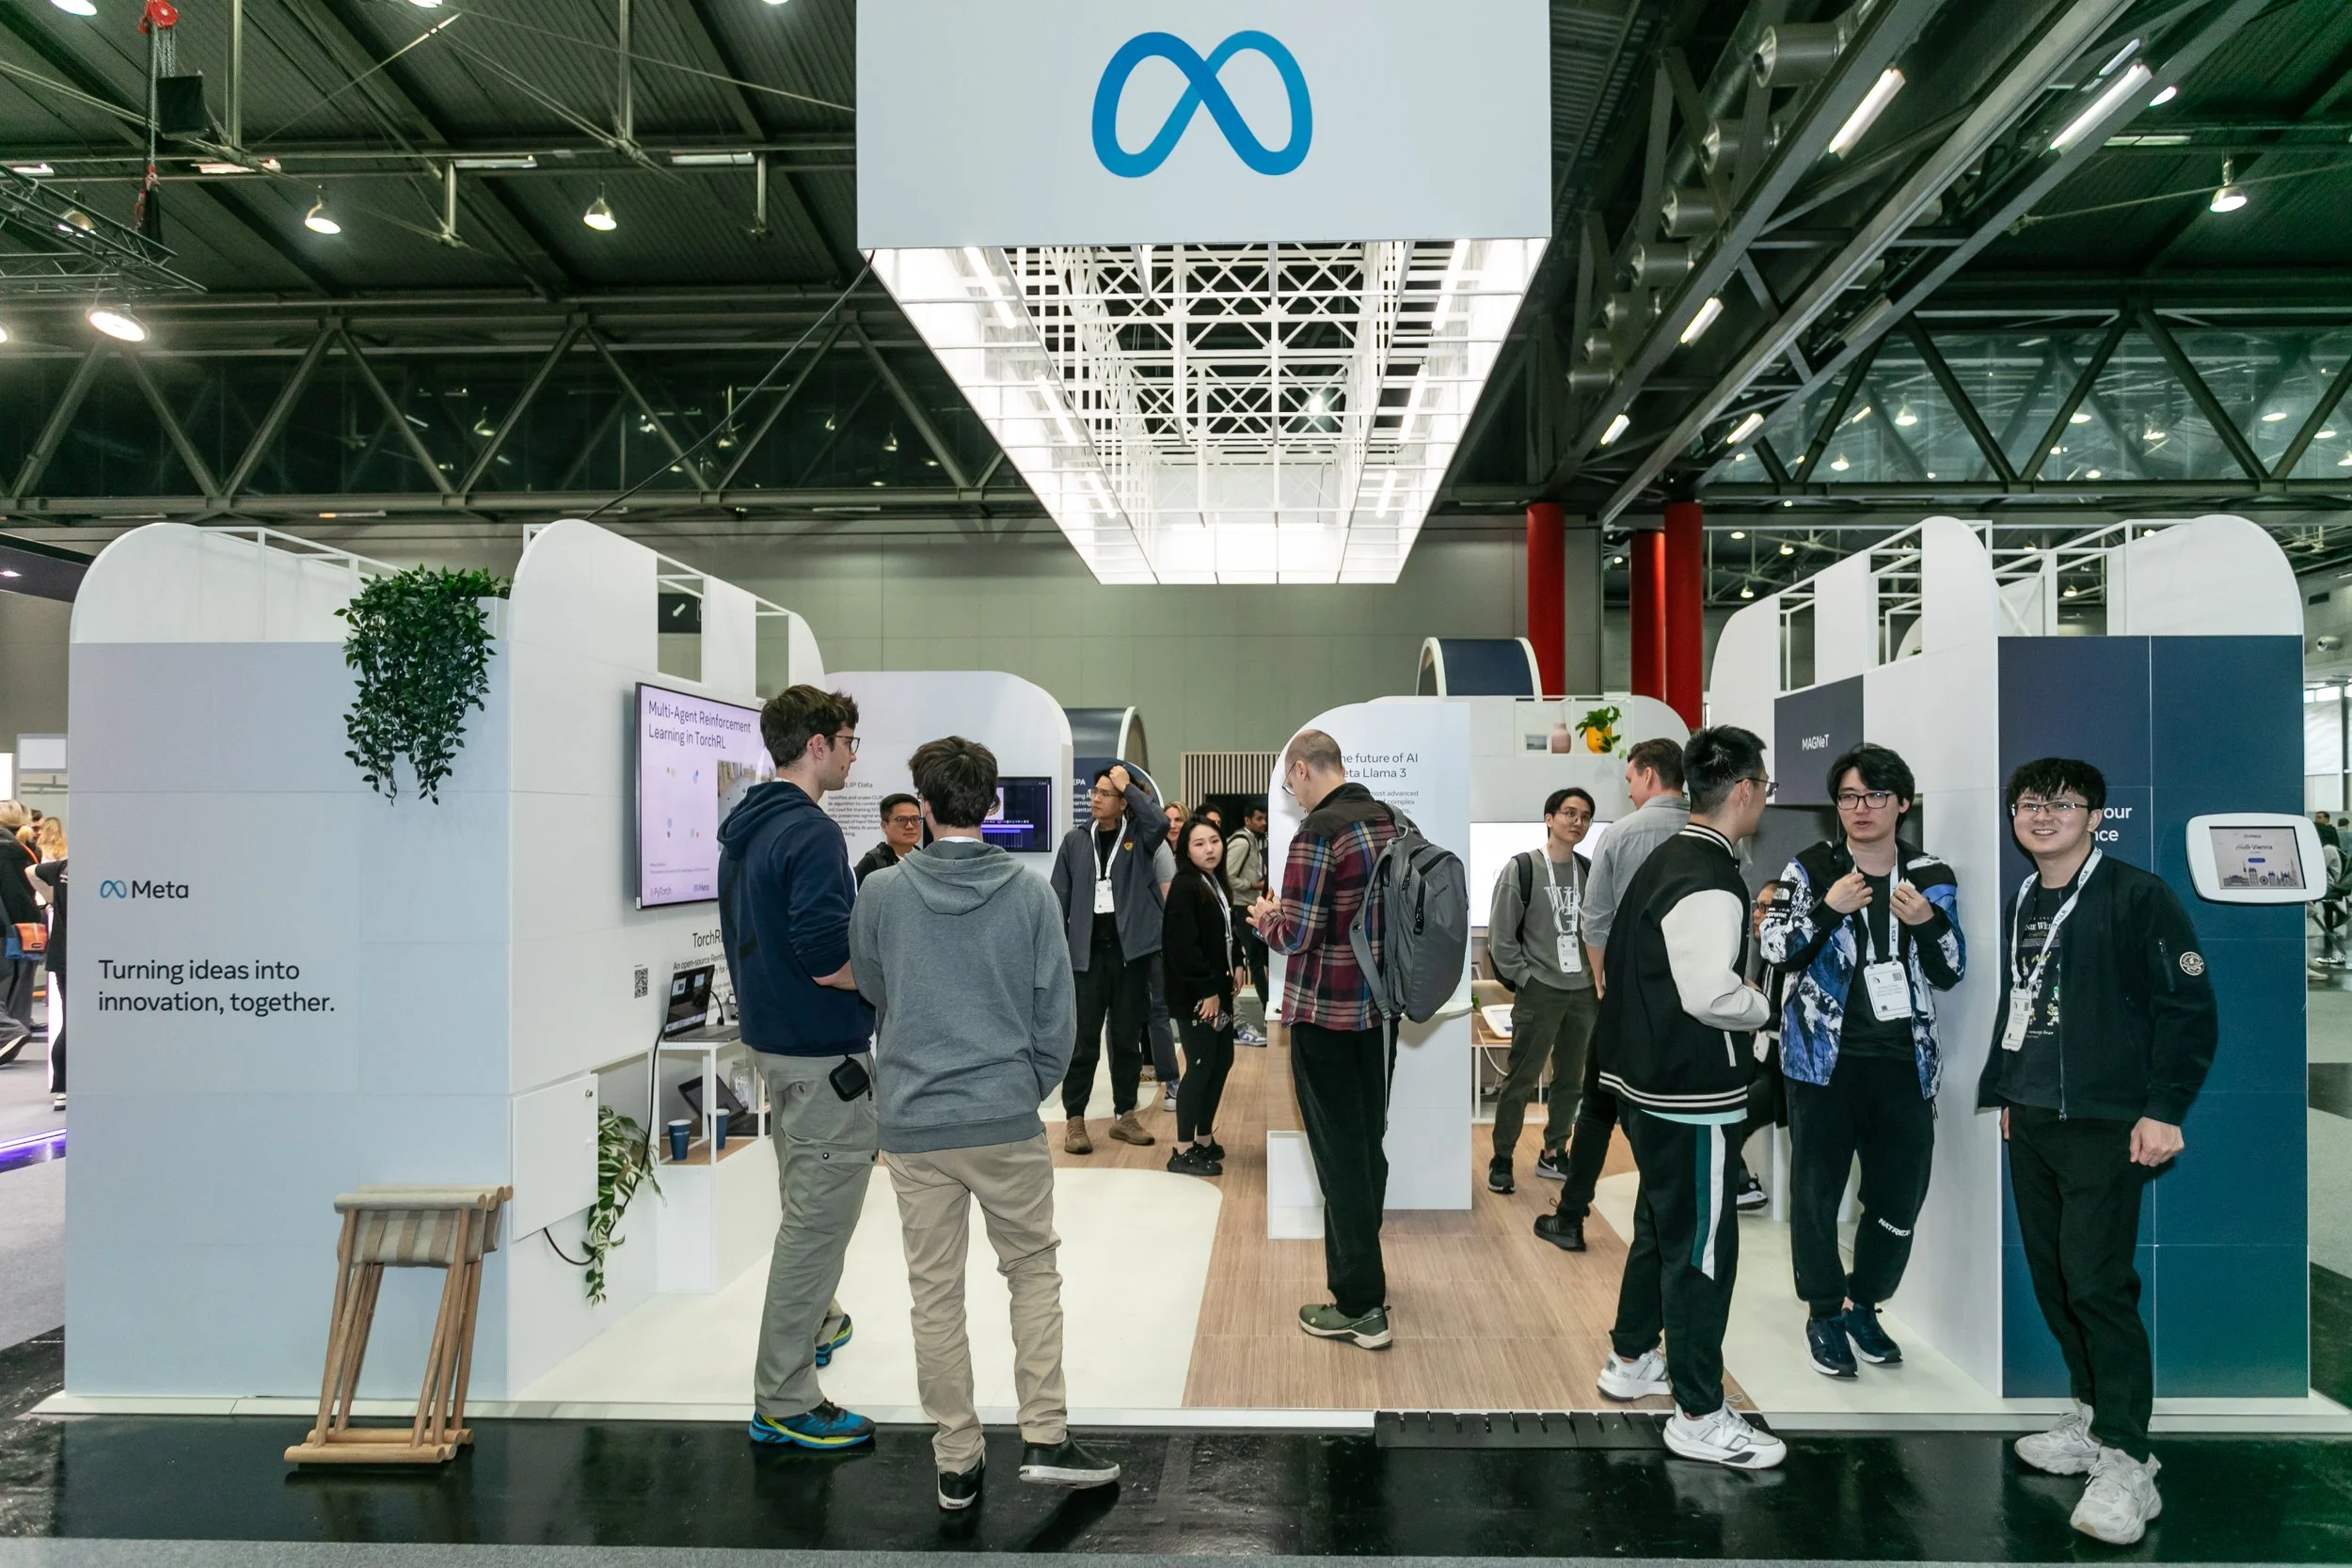
If your activation included digital elements—like apps, touchscreens or immersive experiences—behavioural analytics can reveal powerful insights. Cogs & Marvel’s Meta VivaTech experience is a great example, where interactivity, technology and purposeful design came together to drive measurable engagement. Heatmaps, click tracking, and scroll depth offer clues about what content or features captured attention most effectively.
Partner with Cogs & Marvel to Deliver Impactful Brand Experiences
At Cogs & Marvel, we don’t just create experiences—we engineer them for impact. From initial concept, our team ensures every brand interaction is rooted in strategy and designed for measurable success. If you're ready to elevate your experiential marketing and prove its ROI, let’s connect.
Event Marketing Metrics FAQs
What are the most important event marketing metrics to track?
Key event marketing metrics include foot traffic, dwell time, social media reach, lead conversions, and ROI. Tracking these allows brands to evaluate performance, optimise future activations, and demonstrate real business impact.
How do you measure brand experience effectively?
Measuring brand experience involves both quantitative and qualitative data — including attendee feedback, emotional sentiment analysis, repeat engagement, and brand perception shifts post-event. The goal is to assess how the experience influenced audience connection and loyalty.
What are experiential marketing metrics, and why do they matter?
Experiential marketing metrics are KPIs used to evaluate the effectiveness of immersive brand experiences. These include metrics like engagement time, social mentions, qualified leads, and customer sentiment. They’re essential for proving the value of brand activations and aligning creative with business goals.
What does an experiential marketing agency do?
An experiential marketing agency designs and delivers immersive brand experiences that forge emotional connections with audiences. At Cogs & Marvel, that means creating concept-driven, interactive campaigns that blend storytelling, technology, and design — all tailored to deliver measurable impact.
Can you share some strong experiential marketing examples?
Great experiential marketing examples include branded pop-ups, interactive product demos, immersive installations, and hybrid digital-physical activations. A powerful example is the Pinterest Manifestival, where a bold visual identity and thematic zones encouraged exploration, self-expression, and a high volume of organic social sharing.